Amazon Managed Service for Prometheus(AMP)とAmazon Managed Service for Grafana(AMG)を試すメモ。
参考資料
- https://aws.amazon.com/jp/blogs/aws/amazon-managed-service-for-prometheus-is-now-generally-available-with-alert-manager-and-ruler/
- https://aws.amazon.com/jp/blogs/opensource/best-practices-for-migrating-self-hosted-prometheus-on-amazon-eks-to-amazon-managed-service-for-prometheus/
- https://docs.aws.amazon.com/ja_jp/prometheus/latest/userguide/AMP-getting-started.html
- https://docs.aws.amazon.com/ja_jp/grafana/latest/userguide/what-is-Amazon-Managed-Service-Grafana.html
- https://catalog.us-east-1.prod.workshops.aws/v2/workshops/31676d37-bbe9-4992-9cd1-ceae13c5116c/en-US/amp
- https://catalog.us-east-1.prod.workshops.aws/v2/workshops/31676d37-bbe9-4992-9cd1-ceae13c5116c/en-US/amg
クラスターの作成
1.21でクラスターを作成する。ノードなしで作成する。
cat << EOF > cluster.yaml
apiVersion: eksctl.io/v1alpha5
kind: ClusterConfig

metadata:
  name: amp
  region: ap-northeast-1
  version: "1.21"
vpc:
  cidr: "10.0.0.0/16"

availabilityZones:
  - ap-northeast-1a
  - ap-northeast-1c

cloudWatch:
  clusterLogging:
    enableTypes: ["*"]

iam:
  withOIDC: true
EOF
eksctl create cluster -f cluster.yaml
ノードを作成する。
cat << "EOF" > managed-ng-1.yaml
apiVersion: eksctl.io/v1alpha5
kind: ClusterConfig

metadata:
  name: amp
  region: ap-northeast-1

managedNodeGroups:
  - name: managed-ng-1
    minSize: 2
    maxSize: 2
    desiredCapacity: 2
    privateNetworking: true
    iam:
      attachPolicyARNs:
        - arn:aws:iam::aws:policy/AmazonEKSWorkerNodePolicy
        - arn:aws:iam::aws:policy/AmazonEC2ContainerRegistryReadOnly
        - arn:aws:iam::aws:policy/AmazonSSMManagedInstanceCore
EOF
eksctl create nodegroup -f managed-ng-1.yaml
Adminロールにも管理者権限をつけておく。
CLUSTER_NAME="amp"
USER_NAME="Admin:{{SessionName}}"
AWS_ACCOUNT_ID=$(aws sts get-caller-identity --output text --query Account)
ROLE_ARN="arn:aws:iam::${AWS_ACCOUNT_ID}:role/Admin"
eksctl create iamidentitymapping --cluster ${CLUSTER_NAME} --arn ${ROLE_ARN} --username ${USER_NAME} --group system:masters
ワークスペースの作成
ワークスペースを作成する。
$ aws amp create-workspace --alias my-first-workspace
{
    "arn": "arn:aws:aps:ap-northeast-1:XXXXXXXXXXXX:workspace/ws-c5f58591-8f13-45df-b652-XXXXXXXXXXXX",
    "status": {
        "statusCode": "CREATING"
    },
    "tags": {},
    "workspaceId": "ws-c5f58591-8f13-45df-b652-6e61f1cefa8d"
}
ワークスペースがACTIVEになったことを確認する。
$ aws amp describe-workspace --workspace-id ws-c5f58591-8f13-45df-b652-XXXXXXXXXXXX
{
    "workspace": {
        "alias": "my-first-workspace",
        "arn": "arn:aws:aps:ap-northeast-1:XXXXXXXXXXXX:workspace/ws-c5f58591-8f13-45df-b652-XXXXXXXXXXXX",
        "createdAt": "2021-09-30T12:49:59.132000+09:00",
        "prometheusEndpoint": "https://aps-workspaces.ap-northeast-1.amazonaws.com/workspaces/ws-c5f58591-8f13-45df-b652-XXXXXXXXXXXX/",
        "status": {
            "statusCode": "ACTIVE"
        },
        "tags": {},
        "workspaceId": "ws-c5f58591-8f13-45df-b652-XXXXXXXXXXXX"
    }
}
メトリクスの送信
Prometheusから送信する方法と、ADOTコレクターを使用する方法が紹介されている。
ここではPrometheusで試す。
チャートリポジトリを登録する。
helm repo add prometheus-community https://prometheus-community.github.io/helm-charts
helm repo add kube-state-metrics https://kubernetes.github.io/kube-state-metrics
helm repo update
Namespaceを作成する。
kubectl create namespace prometheus
IRSAをセットアップする。
上記記載がわかりにくいので、eksctlでやる。
Ingest用のポリシーを作成する。
cat << EOF > PermissionPolicyIngest.json
{
  "Version": "2012-10-17",
   "Statement": [
       {"Effect": "Allow",
        "Action": [
           "aps:RemoteWrite",
           "aps:GetSeries",
           "aps:GetLabels",
           "aps:GetMetricMetadata"
        ],
        "Resource": "*"
      }
   ]
}
EOF
aws iam create-policy --policy-name AMPIngestPolicy \
  --policy-document file://PermissionPolicyIngest.json
ロールとServiceAccountを作成する。
AWS_ACCOUNT_ID=$(aws sts get-caller-identity --output text --query Account)
eksctl create iamserviceaccount \
    --name amp-iamproxy-ingest-service-account \
    --namespace prometheus \
    --cluster amp \
    --attach-policy-arn arn:aws:iam::${AWS_ACCOUNT_ID}:policy/AMPIngestPolicy \
    --override-existing-serviceaccounts \
    --approve
Helmのvalueを作成する。
WORKSPACE_ID="ws-c5f58591-8f13-45df-b652-XXXXXXXXXXXX"
AWS_ACCOUNT_ID=$(aws sts get-caller-identity --output text --query Account)
AWS_REGION=$(aws configure get region)
ROLE_ARN=$(eksctl get iamserviceaccount --cluster=amp --name amp-iamproxy-ingest-service-account --output json | jq -r '.[].status.roleARN')
cat << EOF > my_prometheus_values.yaml
## The following is a set of default values for prometheus server helm chart which enable remoteWrite to AMP
## For the rest of prometheus helm chart values see: https://github.com/prometheus-community/helm-charts/blob/main/charts/prometheus/values.yaml
##
serviceAccounts:
  server:
    name: amp-iamproxy-ingest-service-account
    annotations:
      eks.amazonaws.com/role-arn: ${ROLE_ARN}
server:
  remoteWrite:
    - url: https://aps-workspaces.${AWS_REGION}.amazonaws.com/workspaces/${WORKSPACE_ID}/api/v1/remote_write
      sigv4:
        region: ${AWS_REGION}
      queue_config:
        max_samples_per_send: 1000
        max_shards: 200
        capacity: 2500
EOF
ServiveAccountはHelmから作るので消しておく。
$ k delete sa -n prometheus amp-iamproxy-ingest-service-account
serviceaccount "amp-iamproxy-ingest-service-account" deleted
デプロイする。
$ helm upgrade --install prometheus prometheus-community/prometheus \
>   -n prometheus \
>   -f my_prometheus_values.yaml
Release "prometheus" does not exist. Installing it now.
NAME: prometheus
LAST DEPLOYED: Thu Sep 30 13:30:41 2021
NAMESPACE: prometheus
STATUS: deployed
REVISION: 1
TEST SUITE: None
NOTES:
The Prometheus server can be accessed via port 80 on the following DNS name from within your cluster:
prometheus-server.prometheus.svc.cluster.local


Get the Prometheus server URL by running these commands in the same shell:
  export POD_NAME=$(kubectl get pods --namespace prometheus -l "app=prometheus,component=server" -o jsonpath="{.items[0].metadata.name}")
  kubectl --namespace prometheus port-forward $POD_NAME 9090


The Prometheus alertmanager can be accessed via port 80 on the following DNS name from within your cluster:
prometheus-alertmanager.prometheus.svc.cluster.local


Get the Alertmanager URL by running these commands in the same shell:
  export POD_NAME=$(kubectl get pods --namespace prometheus -l "app=prometheus,component=alertmanager" -o jsonpath="{.items[0].metadata.name}")
  kubectl --namespace prometheus port-forward $POD_NAME 9093
#################################################################################
######   WARNING: Pod Security Policy has been moved to a global property.  #####
######            use .Values.podSecurityPolicy.enabled with pod-based      #####
######            annotations                                               #####
######            (e.g. .Values.nodeExporter.podSecurityPolicy.annotations) #####
#################################################################################


The Prometheus PushGateway can be accessed via port 9091 on the following DNS name from within your cluster:
prometheus-pushgateway.prometheus.svc.cluster.local


Get the PushGateway URL by running these commands in the same shell:
  export POD_NAME=$(kubectl get pods --namespace prometheus -l "app=prometheus,component=pushgateway" -o jsonpath="{.items[0].metadata.name}")
  kubectl --namespace prometheus port-forward $POD_NAME 9091

For more information on running Prometheus, visit:
https://prometheus.io/
Podを確認する。alertmanagerとかpushgatewayはなくてもよかった。
$ k get po -n prometheus
NAME                                             READY   STATUS    RESTARTS   AGE
prometheus-alertmanager-964c6c598-d8pgn          2/2     Running   0          47s
prometheus-kube-state-metrics-58c5cd6ddb-tkswk   1/1     Running   0          48s
prometheus-node-exporter-jd4js                   1/1     Running   0          47s
prometheus-node-exporter-zhkgt                   1/1     Running   0          48s
prometheus-pushgateway-6cb4d7b8b5-rcwdk          1/1     Running   0          47s
prometheus-server-5cb5b774f7-pc79k               2/2     Running   0          47s
メトリクスのクエリ
- https://docs.aws.amazon.com/ja_jp/prometheus/latest/userguide/AMP-onboard-query.html
- https://aws.amazon.com/jp/blogs/news/amazon-managed-grafana-getting-started/
- https://docs.aws.amazon.com/ja_jp/grafana/latest/userguide/what-is-Amazon-Managed-Service-Grafana.html
- https://catalog.us-east-1.prod.workshops.aws/v2/workshops/31676d37-bbe9-4992-9cd1-ceae13c5116c/en-US/amg
マニュアルにはAMPを使った方法がないが、AMPを試してみる。
ワークスペースを作成する。


SSOを別リージョンに設定してあるので、以下のようなメッセージがでた。

AMPとCloudWatchをソースとして設定する。

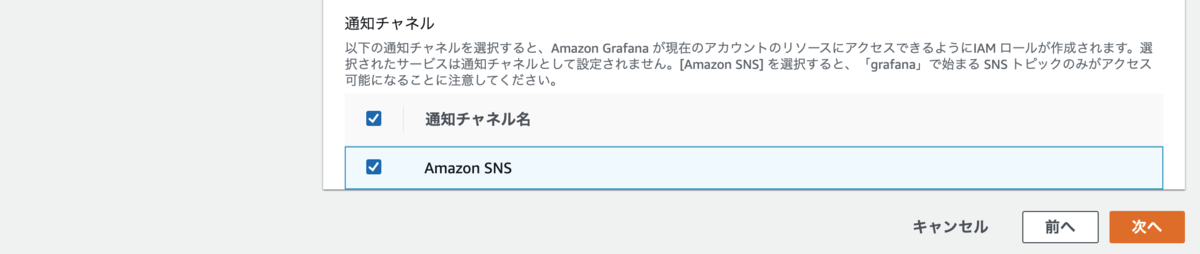
これで作成する。


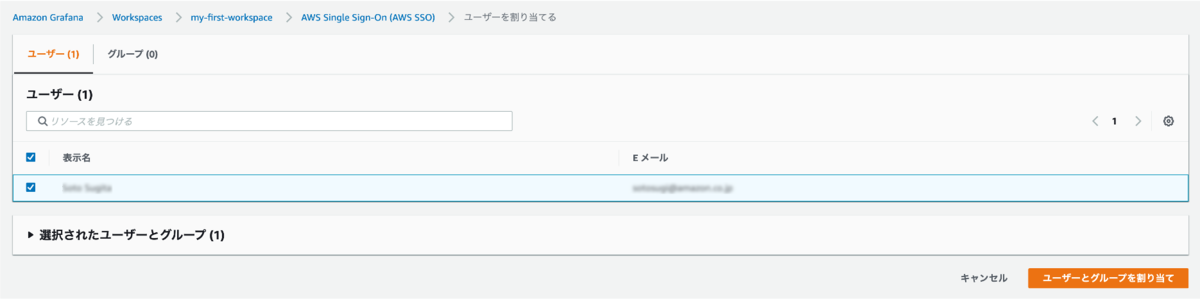
ワークスペースにユーザーの割り当てを行う。

SSOでログインしてみると、Grafanaのワークスペースが見えている。

ログインする。

ログインできた。

これだと何もできないので、ユーザーを管理者にしてあげる必要がある。

ボタンが増えた。

データソースを追加する。


ダッシュボードのインポートで3319を指定する。
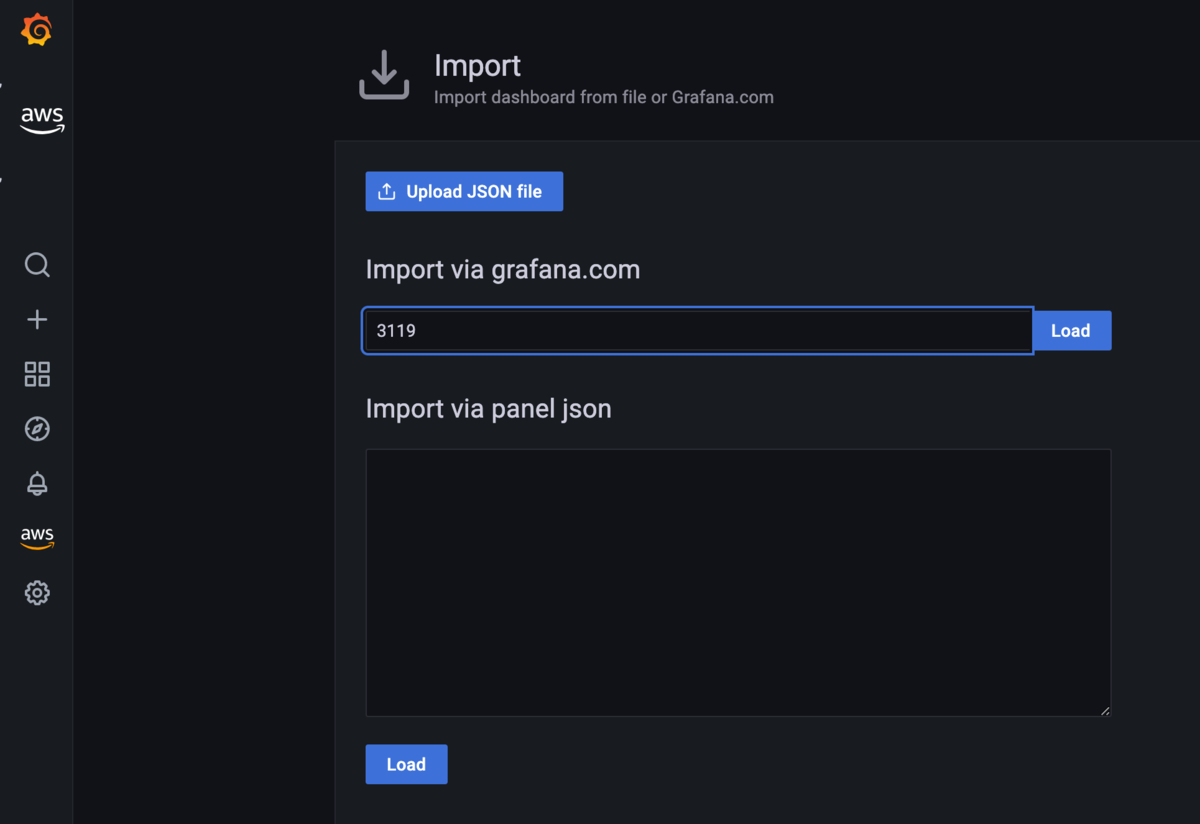
データソースを指定してインポートを実行する。
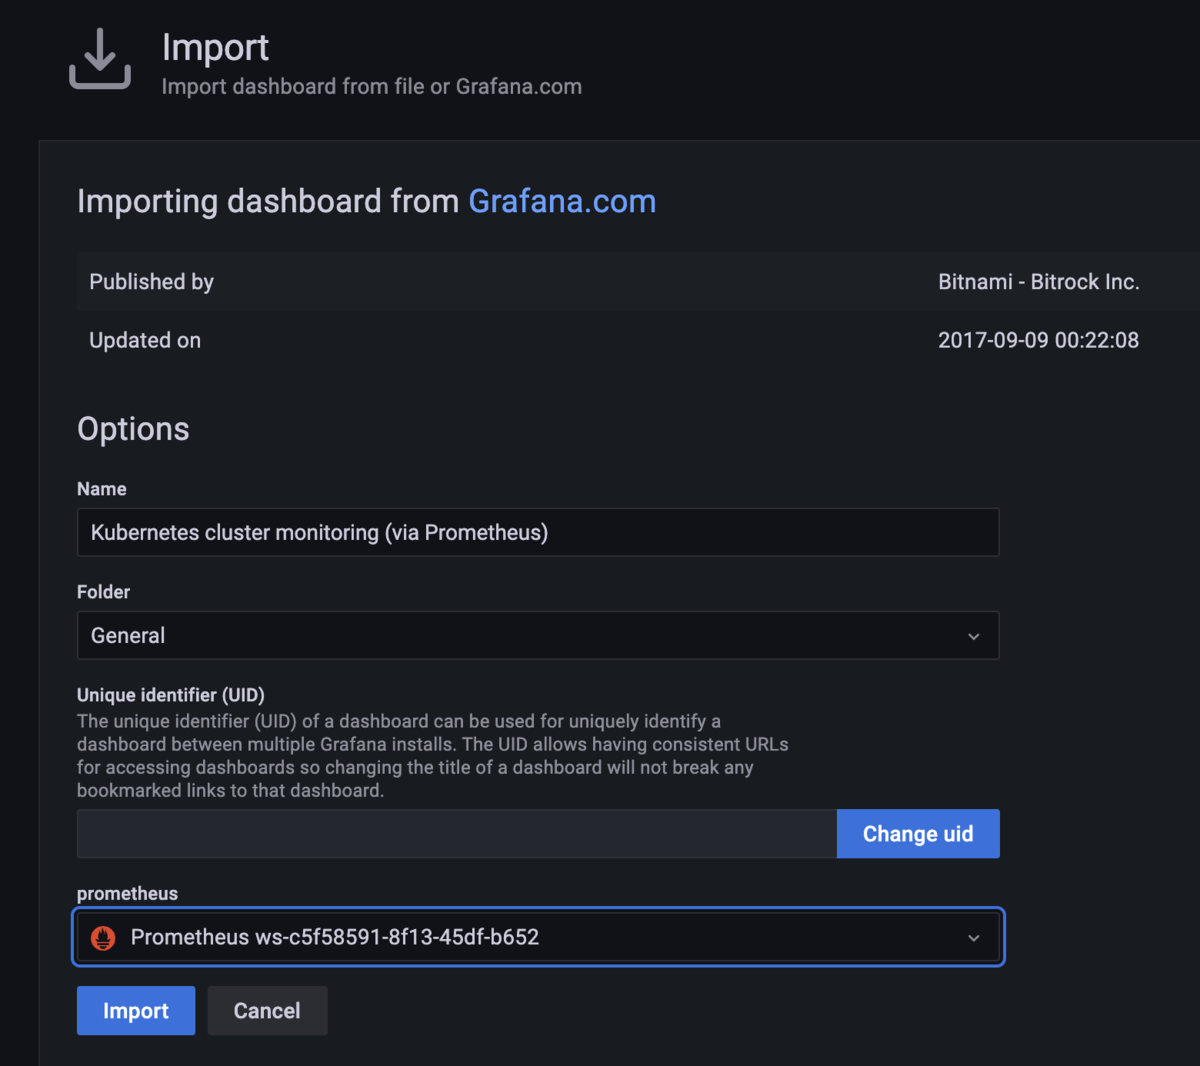
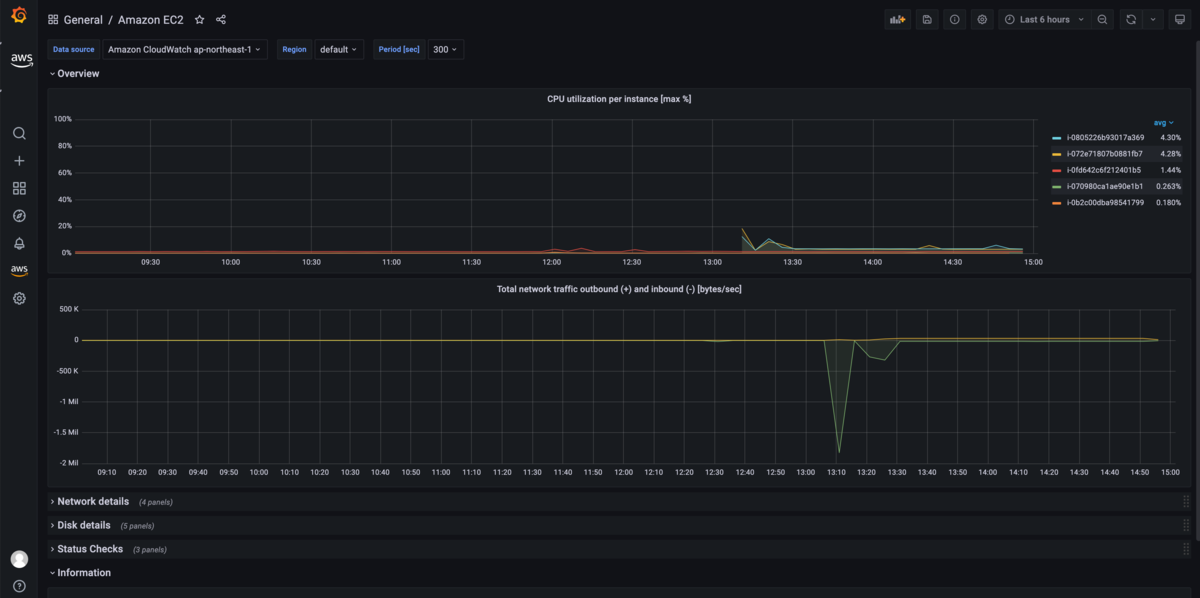
それっぽいのができた。

ダッシュボードを作成してパネルを追加してみる。

- クエリーを指定
sum(container_memory_usage_bytes{image!=""}) by (namespace, pod)
- 凡例のフォーマットを指定
{{ namespace }}/{{ pod }}
- 凡例の場所をRightに指定
- データの単位をbytes(SI)に指定
- パネルのタイトルを指定
これでApplyする。さらに追加する。
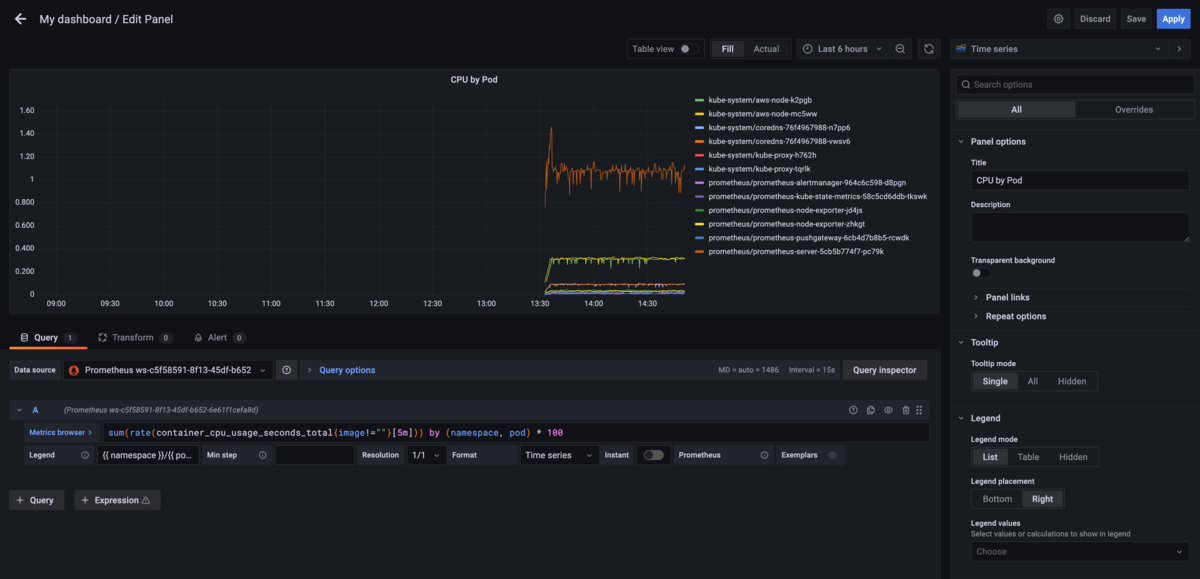
- クエリーを指定
sum(rate(container_cpu_usage_seconds_total{image!=""}[5m])) by (namespace, pod) * 100
- 凡例のフォーマットを指定
{{ namespace }}/{{ pod }}
- 凡例の場所をRightに指定
- データの単位をbytes(SI)に指定
- パネルのタイトルを指定
これでApplyする。
ごく簡単なダッシュボードができた。

CloudWatchデータソースのほうはデータソースにいくつかダッシュボードが付属してくるようだ。